- Published on
Quickstart Guide to VerifyML (Pt 1)
- Authors
- Name
- Jason Ho
- @CylynxTweets


VerifyML is an open-source framework that helps you build fair, responsible, and reliable machine learning (ML) models. Check out our introductory post here!
But not everyone has 5 minutes to read that, so if you want just the meat and potatoes, here it is — a getting-started guide to VerifyML!
This is Part 1 of 2, which describes how you can use VerifyML to easily a create Model Card, annotate it with information about your model, then export it as an HTML or Markdown report. If you’ve been building ML models and are looking for a succinct and portable way to share your findings, read on!
Sample Notebook?
If you’d prefer to see the real thing, check out / clone this sample notebook in our Github repo. The content in this post will be almost identical to that.
Otherwise, feel free to set up a new Python virtual environment (e.g. conda or venv), open up a new notebook, and follow along!
Installation
Install VerifyML by running this in your terminal:
pip install verifyml
For this guide, we’ll be using seaborn for data visualisation, so install that as well:
pip install seaborn
If you already have a notebook open, you can also install these packages by running this in a cell:
!pip install verifyml
!pip install seaborn
Prepare a Sample Dataset and Model
This section prepares a sample dataset and model for populating a Model Card later. If you already have your own model, skip this step and go straight to the “Init Model Card” section below.
Imports
import pandas as pd
import seaborn as sns
import uuid
import verifyml.model_tests.utils as utilsfrom datetime import date
from sklearn.datasets import load_breast_cancer
from sklearn.ensemble import GradientBoostingClassifier
from sklearn.metrics import plot_roc_curve
from sklearn.model_selection import train_test_split
Load Data
In this example, we’ll use the Breast Cancer Wisconsin dataset that comes bundled with sklearn.
cancer = load_breast_cancer()

X = pd.DataFrame(cancer.data, columns=cancer.feature_names)
y = pd.Series(cancer.target)

X_train, X_test, y_train, y_test = train_test_split(X, y)
Data Exploration
Assume we have to plot the mean radius feature for both the train and test sets as part of a basic data exploration step:
sns.displot(x=X_train['mean radius'], hue=y_train)
mean_radius_train = utils.plot_to_str() sns.displot(x=X_test['mean radius'], hue=y_test)
mean_radius_test = utils.plot_to_str()
Two graphs that look like these should appear on the screen:
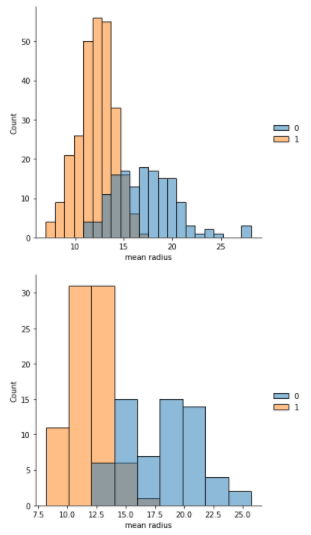 Sample charts from a data exploration step
utils.plot_to_str() converts each plot into a base64-encoded string, required for rendering in the Model Card later.
Create a Classifier
After exploration, we create a GradientBoostingClassifier and plot an ROC curve with it:
clf = GradientBoostingClassifier().fit(X_train, y_train)plot_roc_curve(clf, X_test, y_test)
roc_curve = utils.plot_to_str()
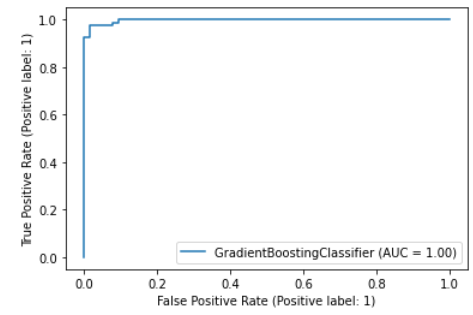 A nicely-overfitted ROC curve
Once that’s done, we can begin working on the actual Model Card!
Init Model Card
To initialise a Model Card Toolkit and a Model Card, use the following code:
# init model card assets using the toolkit
import verifyml.model_card_toolkit as mctlibmct = mctlib.ModelCardToolkit(
  output_dir='model_card_output',
  file_name='first_model_card'
)
model_card = mct.scaffold_assets()
After running the cell above, you should find a new directory with the name you specified in output_dir (model_card_output in this case). It should contain 2 subdirectories for now:
data/: contains a protobuf file with the format<file_name specified above>.proto. In this case, it should befirst_model_card.proto.template/: contains the Jinja templates that will be used later when rendering the Model Card
Populate Model Card
Now, we can start adding information to different sections of the Model Card (all sections are optional):
Model Details
Add name, overview, owners, references, version, etc.
model_card.model_details.name = 'Breast Cancer Wisconsin (Diagnostic) Dataset'
model_card.model_details.overview = 'This model predicts whether breast cancer is benign or malignant based on image measurements.'

model_card.model_details.owners = [
    mctlib.Owner(
        name='Model Cards Team',
        contact='model-cards-team@email.com',
        role='data scientist'
    )
]

model_card.model_details.references = [
    mctlib.Reference(reference='https://archive.ics.uci.edu/ml/datasets/Breast+Cancer+Wisconsin+(Diagnostic)'),
    mctlib.Reference(reference='https://minds.wisconsin.edu/bitstream/handle/1793/59692/TR1131.pdf')
]

model_card.model_details.version.name = str(uuid.uuid4())
model_card.model_details.version.date = str(date.today())
Considerations
Add ethical considerations, limitations, use cases, users, etc.
model_card.considerations.ethical_considerations = [
    mctlib.Risk(
        name='Manual selection of image sections to digitize could create selection bias',
        mitigation_strategy='Automate the selection process'
    )
]

model_card.considerations.limitations = [mctlib.Limitation(description='Breast cancer diagnosis')]
model_card.considerations.use_cases = [mctlib.UseCase(description='Breast cancer diagnosis')]

model_card.considerations.users = [
    mctlib.User(description='Medical professionals'),
    mctlib.User(description='ML researchers')
]
Model Parameters
Add some information about the train and test datasets:
# add details for train and test datasets
mc_dataset_train = mctlib.Dataset()
mc_dataset_test = mctlib.Dataset()

mc_dataset_train.graphics.description = f'{len(X_train)} rows with {len(X_train.columns)} features'
mc_dataset_test.graphics.description = f'{len(X_test)} rows with {len(X_test.columns)} features'

mc_dataset_train.graphics.collection = [mctlib.Graphic(image=mean_radius_train)]
mc_dataset_test.graphics.collection = [mctlib.Graphic(image=mean_radius_test)]

# add details to model card
model_card.model_parameters.data = [mc_dataset_train, mc_dataset_test]
Performance Metrics
Add model performance metrics like accuracy, and do it in a different format:
model_card.quantitative_analysis.performance_metrics = [
  mctlib.PerformanceMetric(
    type='accuracy',
    slice='training',
    value=str((49 + 89) / (49 + 89 + 2 + 3)),
    graphics=mctlib.GraphicsCollection(
      description='ROC curve and confusion matrix',
      collection=[mctlib.Graphic(image=roc_curve)]
    )
  )
]
Unlike previous snippets which were relatively flat in structure, this one nests the instance attribute assignments. Both methods will work fine, although flat tends to be better than nested when it comes to readability.
Update All Changes
Finally, update the model card with all changes made so far:
mct.update_model_card(model_card)
And we’re done building our Model Card!
Export Model Card
To see the fruits of our labour, we can export the Model Card as Markdown or HTML files:
Export as Markdown
template_path=f'{mct.output_dir}/template/md/default_template.md.jinja'

md = mct.export_format(
    output_file='my_first_model_card.md',
    template_path=template_path
)
Note how template_path points to the templates subdirectory that was also previously created when scaffold_assets() was called (model_card_output/templates in this case). If you'd prefer to use your own templates, feel free to use another template_path.
After running the cell above, you’ll find a new subdirectory called model_cards inside the output_dir previously defined in “Init Model Card” . Within it, there will be a Markdown file named whatever was specified in output_file above. In this case, there should be a my_first_model_card.md file in the model_card_output/model_cards/ subdirectory.
Export as HTML
html = mct.export_format(output_file='my_first_model_card.html')
If template_path is not specified, it defaults to the HTML template at f'{mct.output_dir}/template/html/default_template.html.jinja'.
Just like with the Markdown export, the line above will create my_first_model_card.html in model_card_output/model_cards/.
The exported Model Cards can then be shared with business teams / auditors / other stakeholders as a quick summary of a model and its performance. At scale, these can be put under version control and committed to Github, so everyone in the organisation can easily track the development of various models deployed in production.
Displaying
Other than opening up the exported files, the Model Card can also be displayed directly in the notebook, which can help with debugging / development:
from IPython.display import Markdown, HTML # display the markdown
Markdown(md) # or display the HTML
HTML(html)
And the Model Card should appear:
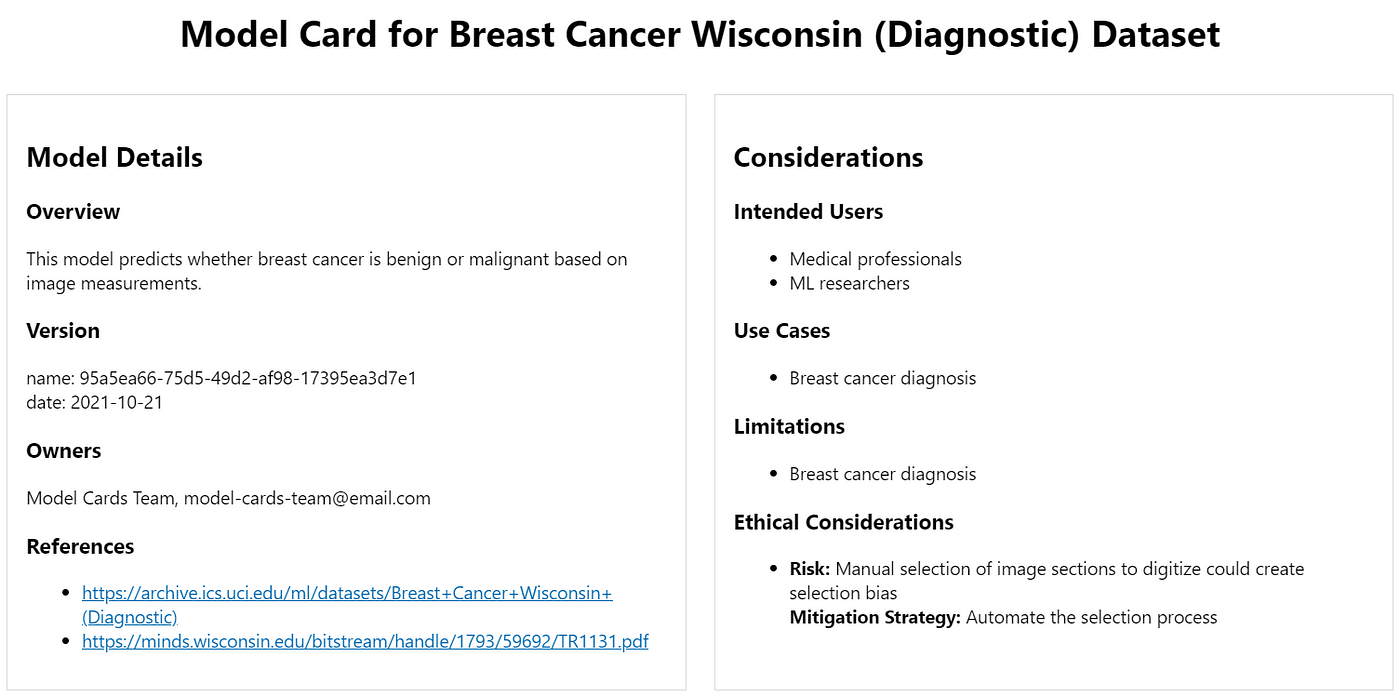 Screenshot of the Model Card (only a part of it)
That’s it for Part 1! You’ve just created a Model Card with VerifyML — an important first step towards building responsible ML. Try applying it to some projects that you’re a part of, and let us know how it goes! We’ll be happy to hear any feedback, comments, bug reports etc. here or on our Github repo.
In Part 2, you’ll learn how to check for unintended biases in your model using various fairness / explainability tests provided out-of-the-box, and even create your own tests if those aren’t enough for your needs. Stay tuned!
EDIT: Part 2 is now available here.